Debugging and optimizing your embedded UI

Get actionable insight into your application data to make better decisions as you build out your Storyboard project.

GET STARTED

Get the most out of your platform

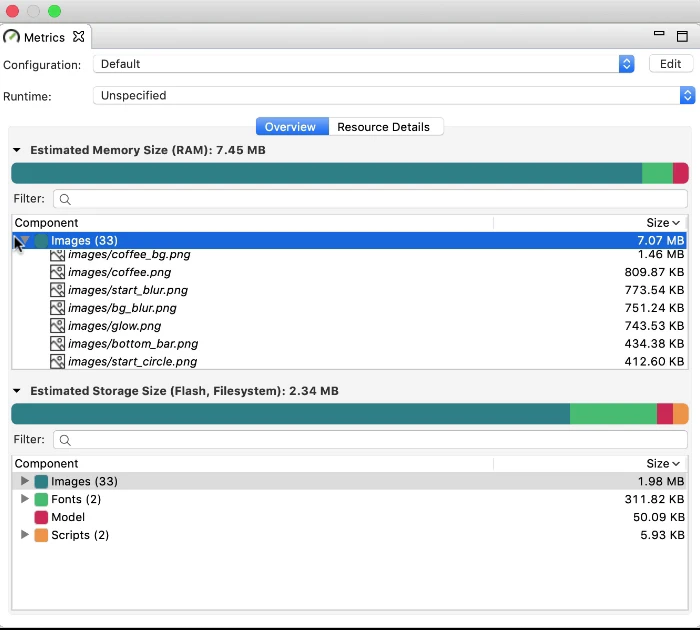
Resources are always limited. Nobody ever complains about having extra memory space or a faster CPU than they need. Get the data insight you need to make smart UI optimization decisions.

With Storyboard's built-in resource management tools, you can do more with less. Monitor your resources directly in Storyboard while you’re building up your embedded application, so you can be confident your performance is 100% optimized for your target hardware when it becomes time to launch.

Understand memory usage

Storyboard’s Metrics View shows you how much memory and storage will be used by the resources within your embedded application, and will help you save and redefine your touch optimized UI where needed.

The real-time resources data allows you to ensure your UI optimization will allow your embedded app to fit your chosen platform's requirements.

With Storyboard, you can be confident that your UI application can leverage and maximize your hardware’s full potential.

DOWNLOAD SAMPLE UI IMAGES ▸

metrics

Visualize performance

Capture Storyboard performance logs and metrics, including redraw times and loading times, with a push of a button within Storyboard, speeding up the process and removing the need for manual setup in advance.

Is your UI not responding properly? Storyboard allows for the graphical representation of data captured within the performance logs making it easier to gain valuable insight into UI design elements that are not performing as expected and potentially impacting your overall user experience. Managing the iterations that come with performance logs are easy within Storyboard.

Long story short, logging key metrics during runtime means you’ll gain easy visibility into statistical data about how your touch-optimized UI design is performing, for a smarter embedded device.

Watch video on Performance Logs ▸

performance-logs2

Create design reports

Want to know everything there is to know about your embedded application design? Create a design report in seconds, based on the information you want to include such as: screens and layers, design states, embedded fonts, images, text translation, metrics, etc.

The customized design report is a great way to share a project overview with colleagues, clients, and any other stakeholder about the resources and UI design elements being used.

Learn more about managing design elements ▸

design-report

Monitor with debug tools

Monitor the execution of your embedded UI application’s scripting with Storyboard’s built-in debugging tool options. You’ll be able to scan through the code line-by-line to better understand the Lua functions for further UI optimization.

Have questions about Storyboard's debugging and optimization tools?

Contact Us ▸

debugger

Need help creating your next embedded project?

With 25+ years of embedded expertise, our team of designers, developers and engineers have you covered and can jump in to help you with your project any time.

GET A QUOTE ▸